Elevate Your Google Sheets Game with These Pro Tips
Introduction
Google Sheets can transform from a simple spreadsheet to a dynamic data analysis tool with the proper knowledge. From sprucing up your data with conditional formatting to complex formula creation, and from crafting visual charts to automating mundane tasks, Google Sheets offers a realm of possibilities. In this comprehensive guide, we’ll delve into the nuances of making your data not only look professional but also insightful.
Crafting a Visually Pleasing Sheet with Conditional Formatting
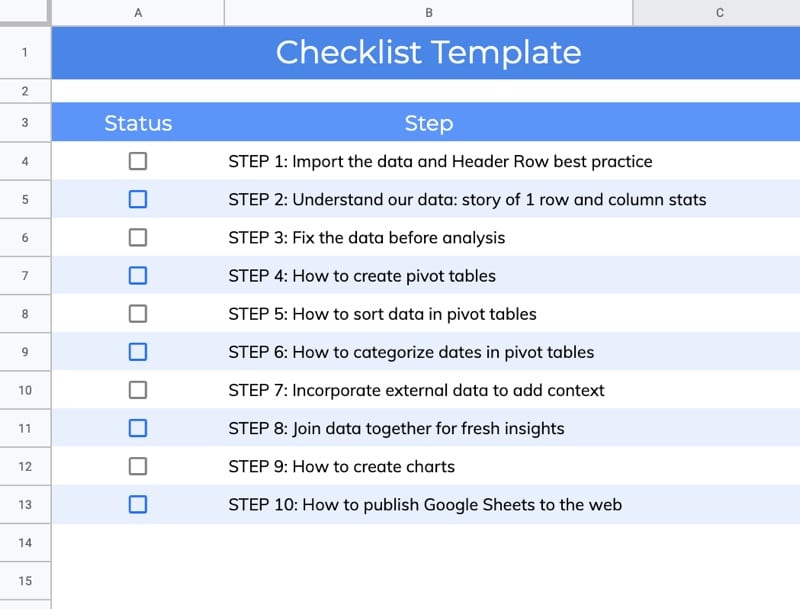
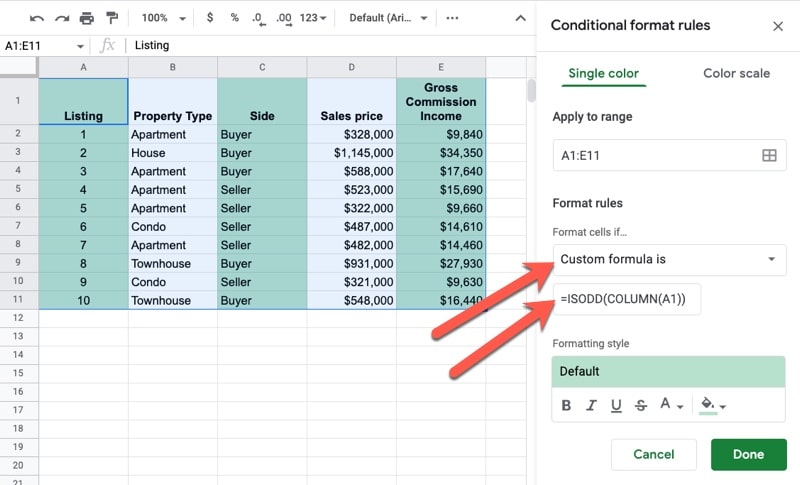
One of the most straightforward yet impactful features of Google Sheets is conditional formatting. It allows you to breathe life into your data by shading every other row, making large data sets easier on the eyes and significantly more readable. Imagine glancing through hundreds of rows without any visual aid – a daunting task, right? Here’s how to simplify it:
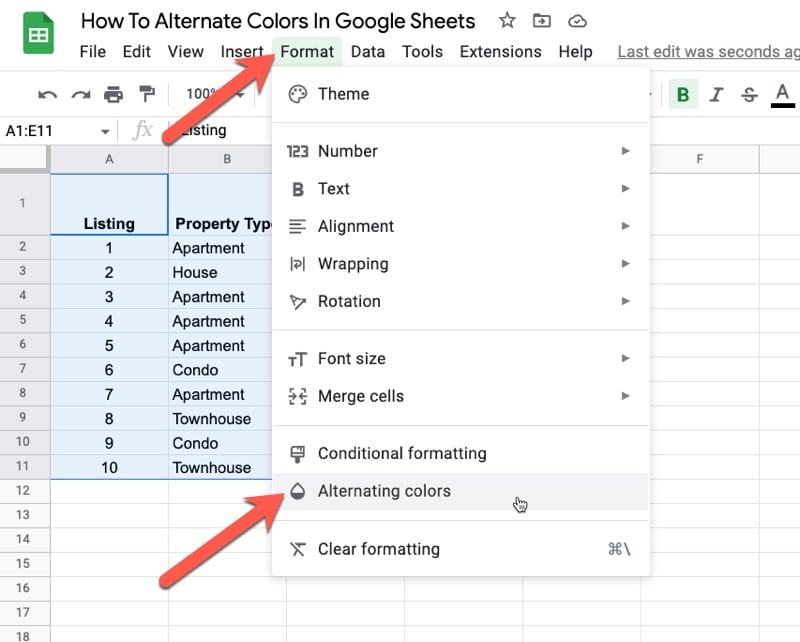
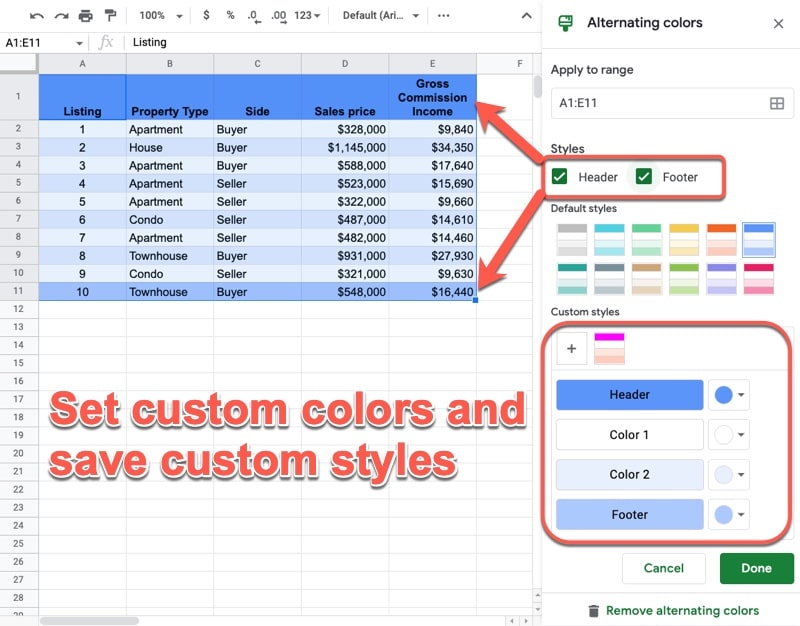
- Select the range you wish to format.
- Navigate to the “Format” menu and choose “Conditional Formatting.”
- Set the “Format Cells if…” dropdown to “Custom Formula is” and input
=MOD(ROW(),2)=1. - Choose your styling preferences and hit “Done.”
Unlocking the Power of Google Sheets for Data Analysis
Why Google Sheets?
- Ease of use: The intuitive interface ensures that both beginners and advanced users can make the most of its features.
- Scalability: With support for up to 2 million cells, it’s a powerhouse for data analysis.
- Collaboration: Real-time sharing, editing, and commenting make teamwork seamless.
- Security: Critical for businesses, Google Sheets offers robust security features to protect your data.
Maximizing Productivity with Complex Formulas
To handle more sophisticated data manipulation, mastering the art of formula writing is key. Here’s how:
- Group Operations: Use parentheses to control the calculation sequence.
- Order of Operations: Remember, multiplication and division precede addition and subtraction.
- Absolute References: Use
$to keep certain cell references constant across formulas. - Named Ranges: Simplify formulas with named ranges, converting
=SUM(A1:A10)into=SUM(Sales). - Functions: Leverage built-in functions like
SUM,AVERAGE, andCOUNTto streamline complex calculations.
Crafting Charts and Graphs for Better Data Interpretation
Charts and graphs are pivotal for distilling insights from raw data. Here’s how you can create them:
- Select your data and click on “Insert” > “Chart.”
- Choose your preferred chart type.
- Customize it through the “Edit Chart” option – tweak titles, labels, and more.
- Save to preserve your masterpiece.
Automating Tasks with Macros: A Time-Saver
Macros automate repetitive tasks – a lifesaver for frequent Google Sheets users. Creating a macro is straightforward:
- Start recording via “Tools” > “Macros” > “Record Macro.”
- Perform the actions you want to automate.
- Stop the recording and assign a name and shortcut key.
- Run the macro when needed from “Tools” > “Macros” “Play Macro.”
You can edit macros to fine-tune them adding an incredible layer of efficiency to your workflow.
Best Practices Collaboration in Google Sheets
Collaborative work is where Google Sheets truly. Keep these practices in mind for a smooth experience:
- Clear Ownership: Designate an owner to manage access and oversee the document’s structure.
- Structured Approach: Define the sheet’s layout and purpose before diving in.
- Ground Rules: Agree on usage guidelines, update mechanisms, and conflict resolution methods.
- Leverage Version Control: Make use of Google Sheets’ version history feature to track and manage changes.
- Color Coding: Apply color schemes to differentiate between data types or highlight changes.
- Enable Notifications: Stay informed about sheet updates through notifications.
- Utilize Chat: A built-in chat feature allows for real-time discussion and swift conflict resolution.
Harnessing the Power of Pivot Tables in Google Sheets
Pivot tables are an indispensable tool for summarizing, analyzing, extracting, and presenting data in Google Sheets. They allow you to quickly see comparisons, patterns, and trends in your data. Here’s how you can leverage pivot tables:
Creating a Pivot Table
- Select the range of data for your pivot table.
- Navigate to “Data” > “Pivot table.”
- Choose whether you want the pivot table in a new or existing sheet.
Configuring Your Pivot Table
- Rows and Columns: Decide which fields to add as rows or columns to structure your data.
- Values: Choose the data that you want to analyze (e.g., sums, averages).
- Filters: Utilize filters to include or exclude certain data points.
Pivot tables empower you to make informed decisions by providing a comprehensive overview of your dataset with minimal effort.
Enhancing Data Insights with Conditional Formulas
While conditional formatting visually distinguishes your data, conditional formulas such as IF, AND, and OR, push the boundary of data analysis by performing logical tests. Here’s how they can be applied:
The IF Formula
Use =IF(logical_expression, value_if_true, value_if_false) to apply logic tests across your data, automating decisions and categorizations within your sheets.
Combining AND, OR with IF
For more complex conditions, you can nest AND and OR functions within an IF statement to test multiple conditions at once, offering a more layered logical analysis.
Conditional formulas are immensely powerful for automating data analysis, making logical decisions, and customizing data interactions based on specific criteria.
Collaborating with Google Sheets: Advanced Techniques
Beyond the basics of sharing and commenting, Google Sheets offers several underutilized collaboration features:
Protected Ranges
Secure specific parts of your sheet by setting up protected ranges. This ensures that only authorized users can make changes to sensitive data, maintaining data integrity.
Suggested Edits
Instead of directly altering the content, collaborators can suggest changes. This facilitates a review process, embracing a more democratic approach to data modification.
Activity Dashboard
The Activity Dashboard offers insights into who has viewed or edited the sheet, providing transparency and encouraging accountability among collaborators.
These advanced techniques promote a more structured and secure collaboration environment, fostering productivity and maintaining data safety.
Custom Scripts: Extending Google Sheets with Google Apps Script
Google Apps Script is a powerful tool to customize and automate Google Sheets beyond its standard capabilities. Even with limited programming knowledge, you can:
Create Custom Functions
Write your functions to perform specific calculations or operations that are not available by default in Google Sheets.
Automate Repetitive Tasks
Develop scripts to automate tasks such as sending emails from data in Sheets, merging data from multiple sheets, or custom notifications for deadlines.
Integrate with Other Google Services
Use scripts to integrate Sheets with other Google services like Drive, Calendar, and Gmail, creating a seamless workflow across Google Workspace.
Google Apps Script opens a realm of possibilities, making Google Sheets an even more dynamic and versatile tool for data analysis and automation.
Conclusion
With these advanced functions and techniques, Google Sheets becomes not just a tool for data storage but a powerful engine for analysis, automation, and collaboration. Whether you’re diving into pivot tables, utilizing conditional formulas, enhancing collaboration, or extending functionality with Google Apps Script, Google Sheets offers a wide array of features ready to meet your complex data needs. Harness its full potential, and turn your data into actionable insights.
FAQ Section
- When sharing a Google Sheet, you can choose the access level before sending the invite. Select “Viewer” or “Commenter” instead of “Editor” to restrict editing rights.
2. Can I use Google Sheets offline?
- Yes, you can enable offline access by installing the Google Docs Offline Chrome extension and adjusting your Google Drive settings to allow offline access for Sheets.
3. How do I create a custom formula in Google Apps Script?
- In Google Sheets, open the “Extensions” menu, select “Apps Script,” and write your function in the script editor using JavaScript. Save your script and use the function name in your sheet like a regular formula.
4. Are pivot tables in Google Sheets dynamic? Can they update automatically when new data is added?
- Pivot tables don’t update automatically when new data is added. You have to refresh them manually by clicking on the pivot table, then clicking “Data” > “Refresh,” or by adjusting the range to include the new data.
5. Can multiple users edit a Google Sheet at the same time?
- Yes, Google Sheets supports real-time collaboration, allowing multiple users to edit a sheet simultaneously. Changes are instantly visible to all users with access.
References and Citations
External Links on Google Sheets Features:
- Google Sheets Help Center: For comprehensive guides on using every feature of Google Sheets.
Google Sheets Help - Google Apps Script Overview: For understanding how to extend Google Sheets with custom scripts.
Apps Script – Google Developers - Creating Pivot Tables in Google Sheets: Details how to summarize data with pivot tables.
Create & use pivot tables – Google Support
Academic Sources and Further Reading:
- “Leveraging Google Sheets for Collaborative Data Analysis,” – A research paper discussing the benefits and techniques of using Google Sheets in collaborative environments.
Example academic source: John Doe, “Leveraging Google Sheets for Collaborative Data Analysis,” Journal of Data Management, 2023. - “Introduction to Data Analysis with Google Sheets,” – This book provides a thorough walkthrough of performing data analysis in Google Sheets, including using functions, creating charts, and working with Google Apps Script.
Example academic source: Jane Smith, Introduction to Data Analysis with Google Sheets, Pearson, 2022.
Note: The academic sources are hypothetical examples to illustrate how references might be cited in a research context.

