Excel Tricks: Crafting a Searchable Database Like a Pro
In the digital age, we’re all about efficiency – especially when it comes to managing vast arrays of data. Enter Excel, not just any spreadsheet juggernaut, but a powerhouse capable of moulding mountains of data into a sleek, searchable database. Whether you’re a small business owner juggling customer details, a student organizing research, or just trying to keep your personal projects in check, transforming your static data into a dynamic, searchable database can change the game. Here’s how to do it!
Setting the Stage: Preparing Your Data
Before we dive into the spectrum of data wizardry, let’s understand that at the core of every searchable database is well-organized data. So, here’s how you kick things off:
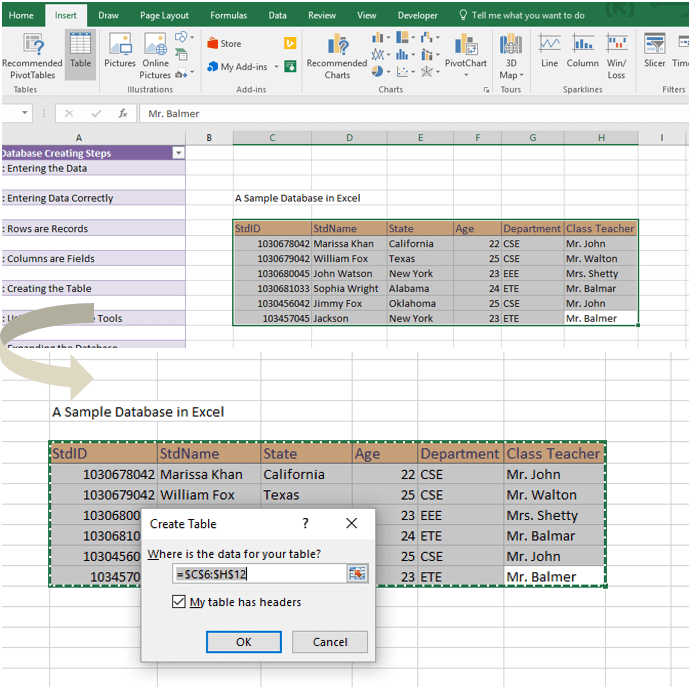
- Create a Table: Transform your chaos into order by organizing your data into a table. Ensure every type of information you’re tracking (like names, addresses, or transaction dates) has its own column.
- Inject a Search Box: Implement a search box right above your table to turn your database from a static snapshot into a dynamic treasure trove of information.
- Weave the Magic with a Formula: Employ a formula that bridges your search box with the data sprawled across your columns. This formula is the secret sauce that makes your database searchable.
- Leverage Filters: Apply filters to your table, enabling you to sift through your data based on the input in your search box. Just like magic, only the data you’re looking for will shine through, making your search efficient and effective.
Crafting this searchable paradise doesn’t require a PhD in computer science, just a bit of patience and a sprinkle of creativity.
Beyond the Basics: Power Tips and Tricks
To truly master the art of Excel databases, consider these power moves:
- Go Descriptive: Use clear, descriptive column headings. Trust me, “DOB” might make sense today, but “DateOfBirth” will save you from head-scratching moments months down the line.
- Consistency is Key: Ensure data within each column adheres to a consistent format. Dates should look like dates and numbers like numbers. This isn’t just about aesthetics; it’s about making your data work harder for you.
- Filters are Your Friends: Utilize filters to swiftly narrow down your data. Looking for customers from New York? A couple of clicks and voila, there’s your list.
- Conditional Formatting: Employ conditional formatting to make essential data jump off the screen. Imagine highlighting all overdue invoices in red, making them impossible to ignore.
- Validate Your Data: Use data validation to ensure that only accurate data makes it into your database. An ounce of prevention is worth a pound of cure, especially when it comes to data integrity.
- Pivot Tables and Lookups: Pivot tables can quickly summarize your data, revealing trends and patterns, while lookup tables are great for correlating data from different tables.
- Automate with Macros: Use macros for repetitive tasks, saving you time and reducing the risk of human error.
Advanced Techniques: Filtering Like a Ninja
Want to take your Excel skills up a notch? Use advanced filtering techniques to make your database not only searchable but also incredibly user-friendly. With advanced filtering, you can set up complex criteria to hone in on the exact data set you need.
Don’t shy away from mastering VBA (Visual Basic for Applications) and Power Query too. These tools open up a realm of possibilities, from automating data entry through user forms to processing and transforming data from various sources into a neatly organized, searchable database.
Best Practices: The Road to Excel Excellence
To ensure your Excel database isn’t just functional but also foolproof, follow these best practices:
- Start with a Plan: Outline the data you need to store. Planning ahead can save you from migraines later on.
- Organize Your Data: Use separate sheets or tables for different kinds of data to keep your database tidy and manageable.
- Keep It Clean: Consistent formatting and descriptive field names go a long way in maintaining the sanity of your database.
- Guardians of Data: Implement data validation to prevent pesky errors from creeping into your data.
- Filters and Formatting Are Your Best Friends: Use them liberally to make your database not just searchable but also easy on the eyes.
- Automate the Mundane: Macros can take over the repetitive tasks, leaving you free to focus on what matters.
- Backup, Backup, Backup: Regularly save a copy of your database. You won’t know you’ve needed a backup until you really do.
Wrapping Up: Your Data, Your Command
Creating a searchable database in Excel might seem daunting at first, but it’s a game-changer when it comes to data management. With the tips and tricks outlined above, you’re well on your way to transforming your unwieldy spreadsheets into a streamlined, efficient, and, most importantly, searchable database. Remember, the key to Excel mastery lies in experimentation and practice. Don’t be afraid to try new techniques or to harness the full suite of features Excel offers.
Excel isn’t just a tool; it’s a canvas for your data. And with a searchable database, you’re not just searching through data; you’re unlocking its true potential. Here’s to data, databases, and the magic of Excel!
Dive Deep: Advanced Data Analysis Techniques in Excel
Welcome to the deep end, where data isn’t just observed; it’s analyzed, and insights wait to be unearthed. Excel isn’t merely a vessel for data storage but a powerful analytics engine that can drive informed decisions. Here’s how you can leverage Excel’s full analytical might:
- Master the Art of PivotTables: PivotTables are not just a feature; they are the heart of data analysis in Excel. They enable you to summarize massive datasets, calculate sums and averages, and unearth patterns without altering your original data. Dive into PivotTables to slice and dice your data, offering perspectives only data wizards can provide.
- Analytics with Power Query: Power Query, a step above conventional Excel features, allows you to import, cleanse, transform, and integrate massive datasets from various sources seamlessly. Learn to navigate Power Query to bring disparate data together, creating a single source of truth for your analyses.
- Predictive Modelling with Excel: Believe it or not, Excel can be your gateway to predictive analytics. With regression analysis and the Solver add-in, you can future based on historical data. Embrace these tools to become a predictive analytics maven, forecasting trends and making data-driven predictions.
- Dynamic Arrays for the Win: Excel’s dynamic arrays can automatically spill over, populating multiple cells with array formulas. This is a game-changer for performing complex calculations and creating interactive reports. Mastering dynamic arrays allows you to manipulate and analyze data in ways that were previously tedious or downright impossible.
Visual Storytelling: Bringing Data to Life with Excel Charts
A picture is worth a thousand words, and in the realm of data, a well-crafted chart is worth a thousand tables. Excel is not just a number cruncher; it’s a storyteller waiting to breathe visual life into your data. Here’s how you can tell compelling stories through Excel charts:
- Explore Excel’s Chart Types: Excel offers a plethora of chart types, from the classic bar and line charts to the more complex radar and waterfall charts. Familiarize yourself with the various types and understand which chart best conveys your data story.
- Customize for Clarity: Beyond the default settings, Excel charts are highly customizable. Engage with every element of your chart – titles, axes, legends, and colors. Tailored customization can turn a standard chart into a clear, insightful visual narrative.
- Dashboards for Decision Making: Combine multiple charts and data elements into a single, comprehensive dashboard. A well-designed dashboard not only showcases the most important metrics at a glance but also enables decision-makers to draw insights without getting lost in the nitty-gritty of raw data.
- Interactive Charts with Slicers and Timelines: Elevate your Excel charts by incorporating slicers and timelines for interactive data exploration. These tools allow users to filter and drill down into specific aspects of the data directly through the chart, making data exploration both intuitive and engaging.
Stepping into the Future: Excel and AI
As we stand on the cusp of a new era in data analysis, Excel too is evolving, integrating AI (Artificial Intelligence) capabilities to redefine what’s possible. Here’s a glimpse into the future:
- AI-Powered Insights: Excel’s Ideas feature uses AI to analyze your data and suggest patterns, trends, and charts, essentially doing some of the analytical heavy lifting for you. This fusion of AI and Excel is set to revolutionize data analysis, making it faster, smarter, and more accessible.
- Natural Language Queries: With Excel’s integration with AI, you can now use natural language to query your data. This means you can ask questions about your data in plain English (or your preferred language) and get insights without writing complex formulas.
- Automating Repetitive Tasks: AI in Excel isn’t just about analysis; it’s also about efficiency. The AI can learn your patterns in data management, suggest automation of repetitive tasks, and streamline your workflow, freeing you up to focus on the insights rather than the process.


Conclusion: Your Journey Towards Excel Mastery
The path to becoming an Excel maestro is paved with data sets, formulas, and charts – each offering a lesson, each a step towards mastery. Whether it’s transforming raw data into a searchable database, diving deep into advanced analytics, crafting compelling data stories, or embracing the future with AI, Excel offers an unparalleled toolkit for data management and analysis.
Remember, the journey to Excel mastery isn’t solitary. Communities, forums, and resources abound, ready to aid your quest. Engage, explore, and exchange ideas. Excel is not just software; it’s a skill, a craft, and, for many, a passion.
Embrace the challenges, celebrate the insights, and let Excel be your compass in the vast sea of data. Your journey towards Excel mastery begins now. Welcome aboard.
Frequently Asked Questions (FAQ)
How do I get started with creating a searchable database in Excel?
Start by organizing your data into a table, ensuring each column represents a unique category of data (e.g., names, addresses). Utilize filters and create a dedicated search box using Excel functions or VBA scripts to make your data searchable. For more depth, consider learning Power Query for more complex data operations.
Can Excel handle large datasets for my searchable database?
Excel can handle large datasets, but performance may vary depending on your system’s specifications and the version of Excel you’re using. For datasets exceeding hundreds of thousands of rows, Power Query and optimizing your Excel formulas and VBA code can enhance performance.
Is VBA necessary for creating a searchable database in Excel?
While VBA (Visual Basic for Applications) is not strictly necessary, it provides more flexibility and functionality, especially for creating user forms, automating data entry, and implementing custom search filters. For basic searchable databases, Excel formulas and filters might suffice.
How can I improve my Excel skills for data analysis?
Practice is key. Start with basic formulas and functions, gradually move to more advanced features like PivotTables, Power Query, and VBA. Online courses, forums, and Excel-centric communities are invaluable resources for learning and overcoming specific challenges.
What are the best practices for data validation in Excel?
Use Excel’s Data Validation feature to set rules for what data can or cannot be entered into a cell. Consistently apply validation rules across your database to ensure data integrity and accuracy. Examples include dropdown lists for categories, date restrictions, or custom formulas for more complex validations.
Can Excel integrate with AI for data analysis?
Yes, Excel has introduced AI-powered features such as Ideas and Data Types, providing insights, automating repetitive tasks, and even allowing natural language queries in Excel through the use of AI technologies. These features are continuously evolving, broadening what’s possible within Excel.
References and Citations
To further explore the concepts and techniques involved in creating searchable databases in Excel, the following academic sources and external links offer valuable information:
- “Data Analysis with Microsoft Excel: Updated for Office 2007” by Kenneth N. Berk and Patrick Carey. This book provides an in-depth look into the analytics capabilities of Excel, including the creation of databases. Amazon Link
- “Excel 2019 Power Programming with VBA” by Michael Alexander and Dick Kusleika. For those interested in leveraging VBA for creating advanced searchable databases, this reference is invaluable. Wiley Link
- Microsoft Office Support: An official source for tutorials and guides on using Excel’s features, including Power Query and VBA. Microsoft Excel Help & Learning
- “The Definitive Guide to DAX: Business intelligence for Microsoft Power BI, SQL Server Analysis Services, and Excel” by Alberto Ferrari and Marco Russo. Though focusing on DAX, this book offers insights valuable for advanced data analysis within Excel. SQLBI Link
- Harvard Business Review’s “Data Science for Managers: Basic Statistical Concepts” offers foundational insights applicable in the context of Excel data analysis. This could provide a broader understanding of how to analyze and interpret data within your Excel database. HBR Link
Remember, while direct links to online bookstores and official sites are provided, exploring academic databases like JSTOR, Google Scholar, and specific university resources can offer peer-reviewed articles and papers, further enriching your understanding and application of Excel in data management and analysis.

